
Root Cause Analysis (RCA): Methods, Process, Template and Example
Use root cause analysis to move beyond the first plausible explanation and identify what is actually driving an operational problem.
When orders are repeatedly late, for example, blaming slow staff may seem reasonable, while the real cause could be incomplete inputs, delayed approvals, system hand-offs, supplier dependencies or unclear ownership.
Root cause analysis (RCA) is not a search for someone to blame, nor is it simply a brainstorming exercise. It is a structured investigation that uses evidence to identify, test and verify the causes behind recurring problems.
This guide explains the RCA process, how to choose appropriate methods such as 5 Whys and Fishbone analysis, how to verify a suspected root cause, and how to use a practical template and worked example.
What Is Root Cause Analysis?
Root cause analysis is a structured way to investigate why a problem occurred, rather than simply describing the visible failure or fixing its immediate symptom. ASQ uses the term as an umbrella for several approaches, tools and techniques designed to identify underlying causes and support continuous improvement.
A useful root cause identification process separates what happened from the conditions that contributed to it and the deeper cause that allowed it to recur.
Not every factor that influences a problem is its root cause, and complex processes may contain several important causal factors rather than one single cause.
A useful root cause should explain the problem, be supported by evidence and identify something the organisation can meaningfully address.
The Root Cause Analysis Process
A reliable root cause analysis process moves from a clearly defined problem to evidence, tested explanations and a verified cause. Skipping one of these root cause analysis steps increases the risk of fixing a symptom while the underlying problem remains.
Define the Problem Before Asking Why
Start by describing the problem precisely before attempting to explain it. Establish what happened, where and when it occurred, how often it happens, who or what is affected, and what should normally have happened.
"Procurement is inefficient" is too vague to investigate. A stronger statement would be:
"31% of supplier invoices received in August required rework before approval, compared with the 5% internal target."
If the issue first appears as a delay or queue, analysing the process bottleneck can help define where the investigation should begin.
Gather Evidence Before Generating Causes
A root cause investigation should be built on evidence rather than assumptions. Useful evidence may include:
- process records and timestamps
- error or rework data
- transaction samples
- system logs
- direct observations
- interviews with people involved
- a current process map
A process map is particularly useful for locating the hand-off, decision or activity where the failure first appears.
Generate Possible Causes Without Declaring a Winner
Use the evidence to develop hypotheses across areas such as people, process, systems, information, materials, environment and controls.
Brainstormed causes are hypotheses, not findings. "The team needs more training" should remain a possibility until evidence supports it.
Analyse Cause-and-Effect Relationships
Choose root cause analysis methods that fit the problem. Common root cause analysis tools and root cause analysis techniques include 5 Whys, Fishbone/Ishikawa analysis, Pareto analysis, change analysis, barrier analysis and process or data analysis. No single technique suits every investigation.
Verify the Cause Before Calling It the Root Cause
This is where root cause identification becomes rigorous. Ask whether the evidence supports the proposed relationship, whether the cause explains when and where the problem occurs, whether contrasting cases behave differently, and whether controlling the cause should materially reduce recurrence. A plausible cause is not yet a verified root cause. ASQ guidance similarly stresses investigating and testing hypotheses before concluding that the underlying cause has been found.
For example, "staff do not follow the procedure" may describe behaviour rather than the deeper cause. If the system allows mandatory validation to be bypassed, the control design may better explain why the behaviour repeatedly produces failure.
Document the Finding and Move to Corrective Action
Record the problem, evidence, confirmed cause or causes, contributing factors, verification method and any remaining uncertainty. At this point, RCA should hand over to the corrective action plan. RCA establishes what caused the problem; corrective action determines what will change, who will act, by when and how effectiveness will be verified.
Choosing the Right Root Cause Analysis Method
Choose root cause analysis methods according to the structure of the problem, the evidence available and the type of causal relationship you need to test. Effective root cause analysis methodology does not begin by selecting a familiar tool; it begins by asking what kind of investigation the problem requires.
| Situation | Useful Method | Why |
|---|---|---|
| A relatively simple causal chain | 5 Whys | Progressively explores what sits beneath an observed problem |
| Several possible categories of cause | Fishbone / Ishikawa | Organises potential causes across structured categories |
| Performance changed after a specific event | Change analysis | Compares conditions before and after the change |
| A control failed to prevent or detect the problem | Barrier analysis | Examines missing, weak or bypassed safeguards |
| Many recurring causes or defect types exist | Pareto analysis | Uses frequency or impact data to identify where problems are concentrated |
These root cause analysis tools serve different purposes. A Fishbone diagram may help a team generate possible causes, while 5 Whys can then explore one promising causal path in greater depth. Pareto analysis, by contrast, helps prioritise where further investigation should focus when many recurring issues exist.
The tool should follow the problem; the problem should not be forced into the team's favourite tool.
The most useful root cause analysis techniques often work together rather than in isolation. The following sections examine 5 Whys and Fishbone analysis in more detail because they are especially practical for operational investigations.
How to Use 5 Whys Without Oversimplifying the Problem
Use 5 Whys analysis to explore a causal chain beneath a clearly defined problem, not to force every investigation into exactly five questions. The 5 Whys method works best when each answer is supported by evidence and becomes the basis for the next question.
A practical sequence is:
- Start with a specific, measurable problem statement.
- Ask why the problem occurred.
- Check whether the answer is supported by available evidence.
- Ask why again, based on the previous supported cause.
- Stop when further questioning no longer improves causal understanding or when a cause is sufficiently verified and actionable.
For example:
This 5 Whys example suggests a process-control issue rather than simply "supplier error", but the conclusion still needs verification against records and comparable cases.
The "five" in 5 Whys root cause analysis is a guideline, not a rule. Some problems may require three questions; others may require seven. A useful 5 Whys template should capture the evidence behind each answer, not merely provide five empty "Why?" boxes.
When a Fishbone Diagram Is More Useful Than 5 Whys
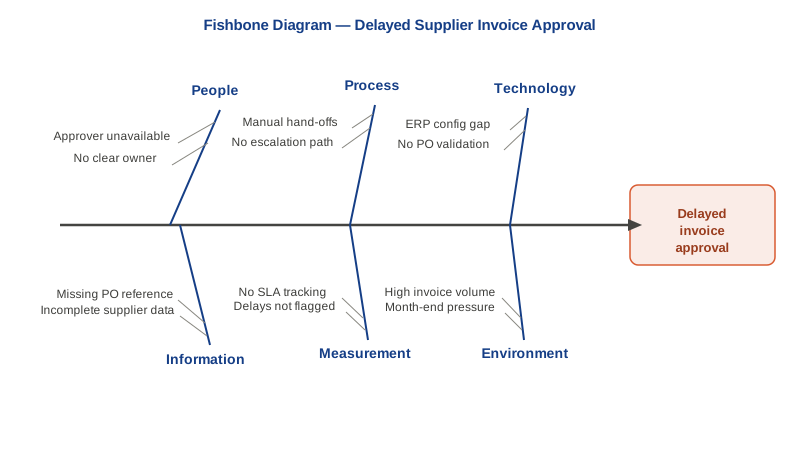
Use fishbone analysis when a problem may have several interacting causes and the causal path is not yet clear enough for a single chain of "why" questions. A fishbone diagram, also known as a cause and effect diagram or Ishikawa diagram, helps a team organise possible causes before deciding which ones deserve investigation.
Typical categories can include:
- people;
- process;
- technology or equipment;
- materials or inputs;
- measurement;
- environment.
The categories should fit the problem rather than being treated as fixed rules. In an operational issue such as delayed supplier invoice approval, for example, possible causes might span unclear ownership, missing purchase-order data, system configuration, supplier information and approval rules.
A fishbone diagram generates and organises hypotheses; it does not prove them.
[Fishbone Diagram — Delayed Supplier Invoice Approval]
After the diagram is populated, prioritise the most plausible branches, gather evidence, test the proposed relationships and verify the causes before drawing conclusions.
The distinction is useful: 5 Whys drills deeper into one causal path, while fishbone root cause analysis explores several possible branches. The two can also work together: use Ishikawa root cause analysis to structure the possibilities, then apply 5 Whys to a promising branch that evidence supports.
Copyable Root Cause Analysis Template
Use this root cause analysis template to document the investigation from the original problem through to a verified cause. It can be adapted as an RCA template, root cause analysis form or the core of a root cause analysis report, depending on how your organisation records improvement work.
| Field | What to Record |
|---|---|
| Problem statement | What occurred, where, when and at what scale |
| Expected condition | What should have happened instead |
| Evidence collected | Data, records, observations, interviews or samples reviewed |
| Potential causes | Hypotheses identified during the investigation |
| Analysis method | 5 Whys, Fishbone, change analysis or another suitable method |
| Evidence supporting cause | Facts that are consistent with the proposed cause |
| Evidence against cause | Facts that challenge or weaken the hypothesis |
| Contributing factors | Conditions that influenced the problem but do not fully explain it |
| Verified root cause(s) | Cause or causes sufficiently supported by evidence |
| Verification method | How the causal relationship was tested or confirmed |
| Recommended hand-off | The issue that should now move into corrective-action planning |
Copy this root cause analysis template into Word, Excel, Google Docs or your organisation's quality or improvement system.
A useful root cause analysis report template should preserve the reasoning behind the conclusion, not simply record the final answer. It should therefore stop at the verified cause and hand-off point. Action owners, due dates, implementation status and effectiveness reviews belong in the corrective action plan, where the organisation decides what will change and how that change will be monitored.
A Root Cause Analysis Example: Repeated Supplier Invoice Rework
Consider this root cause analysis example: 30% of invoices from a group of suppliers require manual rework because the required purchase-order reference is missing.
The investigation begins by reviewing invoice samples, supplier records, purchase-order communications and approval timestamps. Initial explanations might include supplier error, unclear instructions, insufficient staff training, ERP configuration or inconsistent supplier onboarding.
A Fishbone diagram can organise these possibilities, while a 5 Whys example can explore the strongest evidence-backed branch in greater depth. The investigation should not stop at:
"Suppliers forget to include the PO number."
Further analysis may show that required PO information is not consistently transmitted during supplier onboarding and order confirmation, while the invoicing process allows invoices to be submitted without that reference.
Verification is then essential. For example:
The first explanation — supplier error — identified where the defect appeared. RCA analysis identified the process condition that repeatedly allowed it to occur.
If evidence instead shows that the problem remains concentrated among particular suppliers after the internal process is controlled, the issue can then move into supplier performance management for KPI monitoring, improvement actions or escalation.
Common Root Cause Analysis Mistakes
Weak root cause analysis often fails because the investigation moves too quickly from problem to solution. Common mistakes include:
A strong investigation should leave a traceable line from the original problem to the evidence, the hypotheses considered and the cause ultimately verified. If another reviewer cannot trace the conclusion from the problem statement through the evidence to the verified cause, the analysis is not yet strong enough to support corrective action.
Strengthen Process Analysis and Improvement with LOTC
Identifying a plausible cause may end an investigation quickly; verifying it gives an organisation a reliable basis for improving the process. Strong root cause analysis therefore depends not only on analytical tools, but also on understanding how work flows, where inefficiencies occur and how evidence can guide meaningful improvement.
LOTC's Business Process Improvement and Mapping course develops these capabilities through practical process analysis, mapping and workflow improvement techniques. It is particularly relevant for operations managers, business analysts, quality professionals and teams responsible for improving organisational processes.
To discuss the course or arrange training for your organisation, contact LOTC on WhatsApp.